
Net Rating in Basketball Betting: Efficiency Metrics for EuroLeague Analysis
 Available in US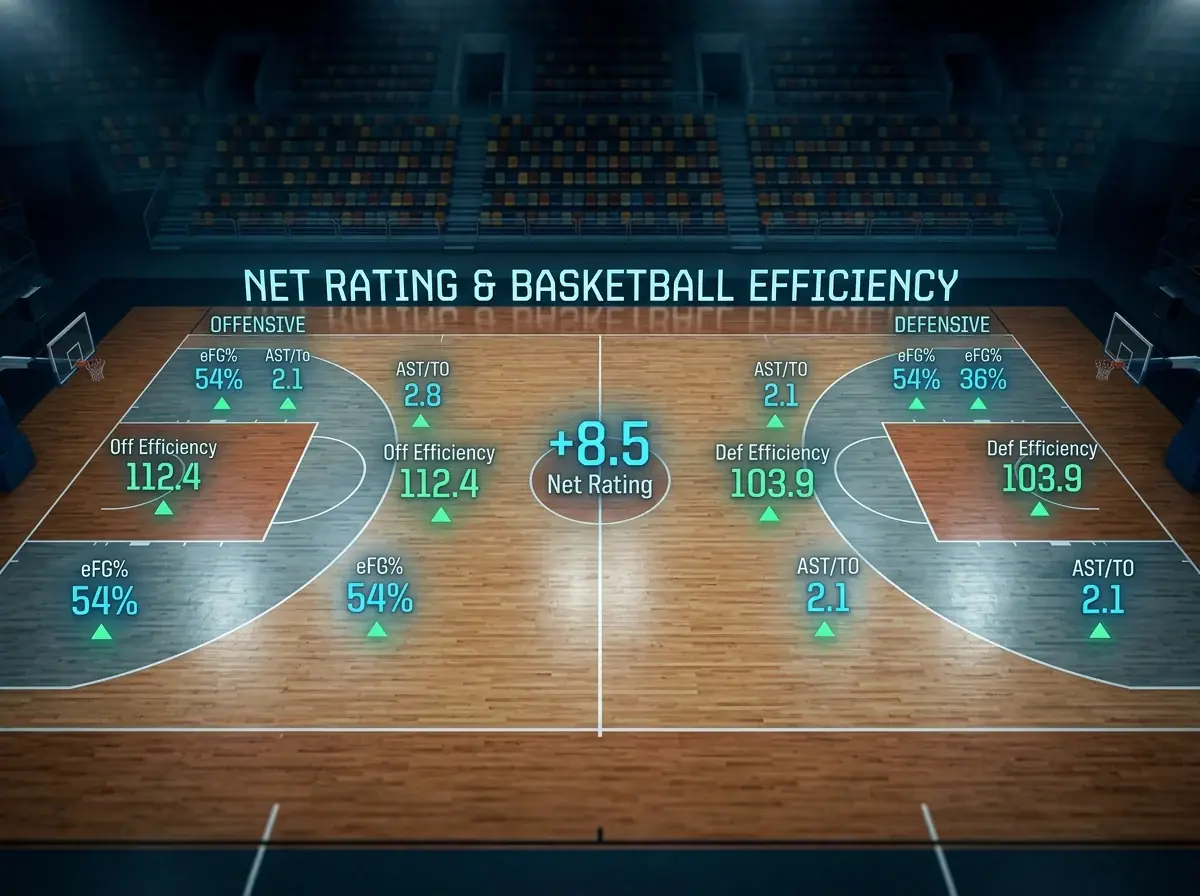
The first round of the 2025-26 EuroLeague season revealed something fascinating in the early efficiency data. Fenerbahce posted an elite Net Rating of +21.3 with a Defensive Rating of 95.4, while Hapoel Tel-Aviv led all clubs with an Offensive Rating of 138.1. These numbers told me more about competitive potential in ten games than win-loss records possibly could. Efficiency metrics cut through variance to reveal sustainable performance levels.
Net Rating – the difference between points scored and points allowed per 100 possessions – is the single most important team-level efficiency metric in basketball analytics. Understanding how to calculate, interpret, and apply Net Rating transforms your EuroLeague handicapping from result-chasing to process-focused analysis.
Net Rating, Offensive and Defensive Rating Explained
Offensive Rating measures points scored per 100 possessions. This normalisation eliminates pace differences that distort raw scoring averages. A team scoring 80 points in a 70-possession game (114.3 ORtg) is more efficient than one scoring 85 in an 80-possession game (106.3 ORtg), despite the lower raw output.
Defensive Rating measures points allowed per 100 possessions. Lower is better – elite defences hold opponents below 100 points per 100 possessions while poor defences allow 110+. The same pace normalisation applies, letting you compare defensive performance across teams with different playing speeds.
Net Rating subtracts Defensive Rating from Offensive Rating. A team with 110 ORtg and 105 DRtg has +5.0 Net Rating, meaning they outscore opponents by 5 points per 100 possessions on average. This single number captures overall team quality more accurately than any other metric.
Possession-based calculation requires estimating possessions from box score data. The standard formula uses field goal attempts, free throw attempts, offensive rebounds, and turnovers to approximate total possessions. Different estimation methods produce slightly different results, so consistency in methodology matters more than precision in any single calculation.
EuroLeague Efficiency Leaders 2025-26
Early-season efficiency data from the first round showed dramatic separation between elite performers and the field. Fenerbahce’s +21.3 Net Rating combined both offensive competence and defensive excellence, suggesting genuine championship-calibre play rather than result variance.
Hapoel Tel-Aviv’s 138.1 Offensive Rating represented an unsustainable outlier that small samples sometimes produce. No team maintains such extreme efficiency across a full season – but the number indicated offensive potential that might settle at still-elite levels as sample size increases.
Defensive Rating below 100 signals elite defence in EuroLeague context. Fenerbahce’s 95.4 DRtg placed them among the best defensive units on the continent. Teams struggling above 110 DRtg face structural problems that require tactical adjustments or personnel changes to address.
Mid-season recalibration becomes necessary as early-season volatility smooths. A team posting +15 Net Rating through ten games might stabilise at +8 by game 20 – still excellent but different for betting purposes. Tracking trajectory alongside current levels helps distinguish genuine quality from temporary hot streaks.
Applying Efficiency Metrics to Spread Betting
Net Rating differential translates approximately to expected margin. Two teams with +5 and -3 Net Ratings have an 8-point differential that suggests the better team should win by roughly 8 points on neutral court. Home court adds 3-4 points to this baseline expectation.
Spread value emerges when market pricing diverges from efficiency-implied margins. If efficiency analysis suggests Team A should beat Team B by 6 points but the spread is only -3.5, value exists on Team A covering. This systematic approach removes emotional reactions to recent results.
Offensive and Defensive Rating separately help predict totals. Two high-ORtg teams meeting suggests over potential; two low-DRtg teams suggests defensive struggle trending under. Breaking Net Rating into components provides insight that the aggregate cannot.
Matchup-specific adjustments modify baseline expectations. A team with elite offensive efficiency facing a team with elite defensive efficiency creates different dynamics than one where both teams have moderate ratings on both ends. Understanding the stylistic implications of efficiency profiles adds nuance to spread predictions.
Adjusting for Opponent Strength
Raw efficiency metrics do not account for schedule difficulty. A team posting +10 Net Rating against weak opponents differs from one achieving the same against elite competition. Strength of schedule adjustments contextualise efficiency numbers within the competitive environment that produced them.
Opponent-adjusted metrics recalculate efficiency relative to expected performance against each specific opponent. If average offensive production against a particular defence is 105 ORtg and you posted 112, your adjusted offensive performance exceeds average by 7 points – more meaningful than the raw 112.
EuroLeague’s round-robin format ensures all teams face similar competition by season end. Early-season schedule differences wash out as the 38-game schedule ensures repeated exposure to strong and weak opponents. Mid-season efficiency ratings on unadjusted basis become increasingly reliable as schedules balance.
Home/away splits within efficiency metrics reveal travel impact. Some teams maintain efficiency on the road; others collapse away from home. These splits help predict which teams will exceed or fall short of aggregate efficiency expectations in specific venue contexts.
Frequently Asked Questions
What is a good Net Rating in EuroLeague?
Net Rating above +5.0 indicates a strong team likely to make playoffs. Above +10.0 suggests elite, championship-contending quality. Below -5.0 indicates a struggling team likely to miss playoffs. The spread from best to worst typically ranges from approximately +15 to -15 across the 20-team league.
How do I calculate expected margin from Net Rating differences?
Subtract the away team’s Net Rating from the home team’s Net Rating, then add approximately 3-4 points for home court advantage. A home team with +8 Net Rating facing a visitor with +2 Net Rating has a 6-point efficiency gap plus 3-4 for home court, suggesting expected margin around 9-10 points.
Efficiency-Based Betting Decisions
Make efficiency metrics central to your handicapping process. Before considering recent results, team news, or emotional factors, establish the efficiency baseline that tells you how teams actually perform when variance is removed. This foundation keeps analysis grounded in sustainable factors rather than random fluctuations.
Build efficiency tracking into your routine data collection. Weekly updates of Offensive Rating, Defensive Rating, and Net Rating for all 20 EuroLeague teams take minimal time but provide ongoing reference points that inform game-by-game analysis.
Combine efficiency with situational factors for complete analysis. A team with strong efficiency but heavy travel fatigue may underperform their numbers; one with weak efficiency but extra rest and home advantage may exceed them. Efficiency establishes baseline; situational factors modify it.
The first-round efficiency data showing Fenerbahce’s elite balance and Hapoel’s offensive explosion illustrated how quickly meaningful patterns emerge when you know where to look. Efficiency metrics provide that focus – cutting through noise to reveal the signal that predicts future performance better than past results alone.
Published by the Euroleague Basketball Betting team.