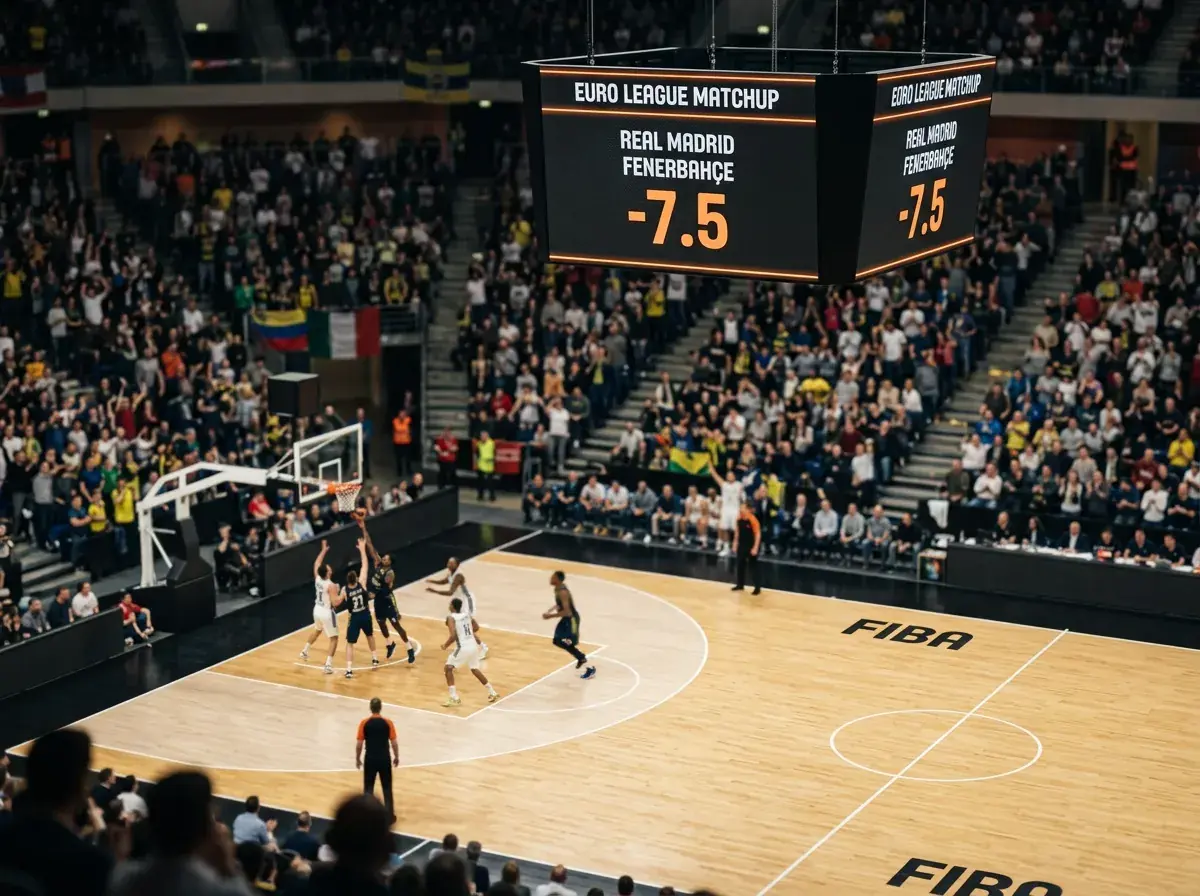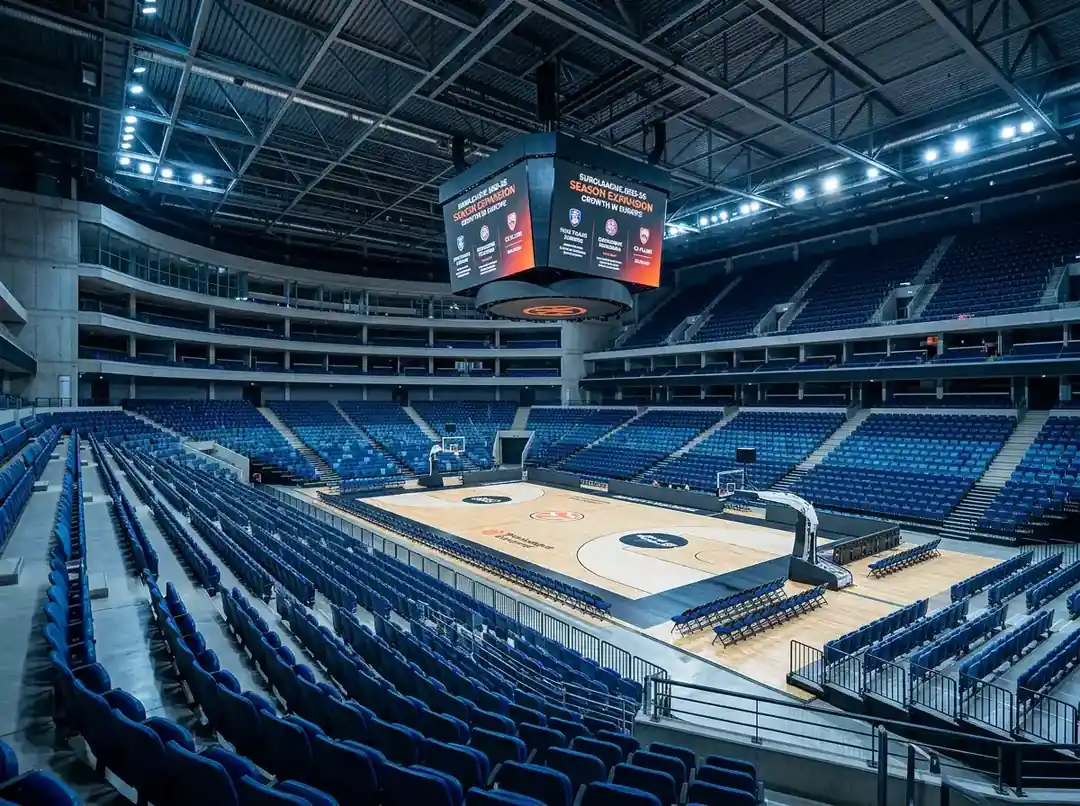
EuroLeague Attendance Statistics: Crowd Data for Betting Context
 Available in US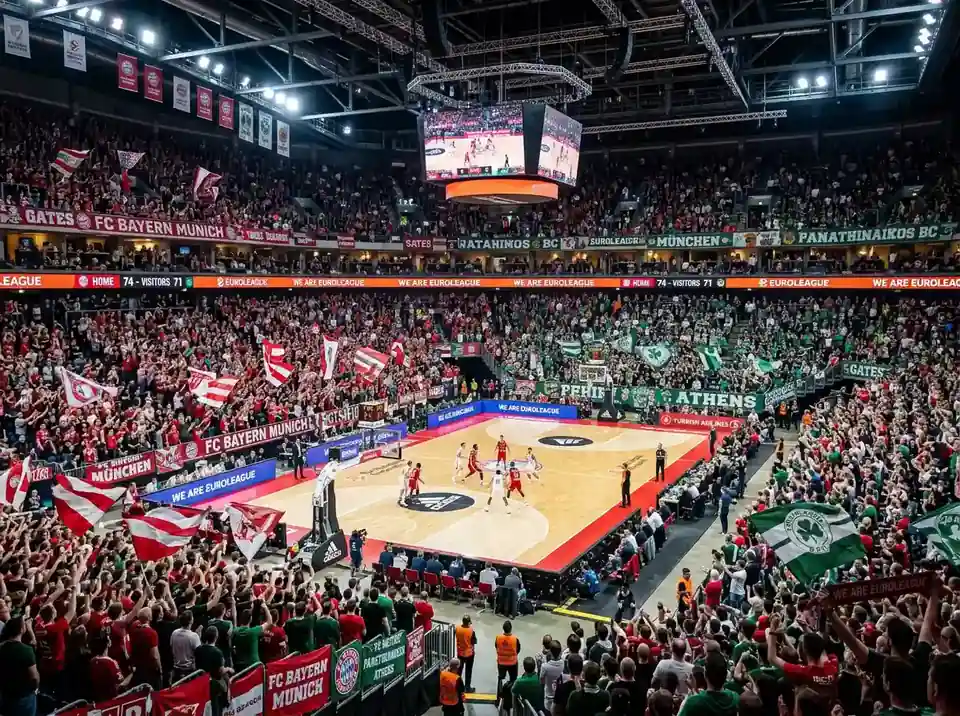
Bayern Munich’s attendance numbers from 2024-25 made me completely rethink how I approach their home games. The move to SAP Arena produced a 75% year-over-year attendance increase – 10,872 average fans at 97% capacity. A team that previously offered minimal home advantage suddenly became dangerous at home in ways their prior season data could not predict. Venue changes matter enormously when they transform crowd dynamics.
Attendance statistics provide quantitative backbone to the intuitive sense that some arenas are harder to play in than others. Understanding which venues genuinely intimidate visitors and which merely provide home uniforms helps calibrate spread adjustments and identify games where market home court pricing may be wrong.
Record-Breaking 2024-25 Attendance
EuroLeague set its fourth consecutive attendance record in the 2024-25 regular season, averaging 10,589 spectators per game – a 2% increase over the previous campaign. Total attendance reached 3,039,060 fans across all regular season fixtures. These league-wide figures establish baselines that individual club data should be measured against.
The growth trajectory indicates sustained audience development rather than one-off spikes. Year after year increases suggest genuine market expansion that should continue into 2025-26 and beyond. Growing audiences typically correlate with growing betting markets and improving competitive quality.
Not all attendance growth reflects equally on crowd intensity. Some increases come from arena expansions that add casual fans; others come from improved supporter organisation that intensifies existing crowds. Understanding the nature of attendance growth helps interpret its competitive implications.
Attendance by Club and Arena
Partizan Belgrade led EuroLeague attendance with 18,486 average fans at 98% arena capacity. The combination of near-capacity crowds and Serbian basketball culture creates an environment that visiting teams consistently describe as the league’s most hostile. These numbers justify meaningful home court adjustments beyond standard market pricing.
Crvena Zvezda, Belgrade’s rival, followed closely at 18,239 average attendance with 94% capacity utilisation. Together, the Serbian clubs demonstrate that market size alone does not determine attendance – passionate basketball cultures in smaller cities can exceed major European capitals in creating atmosphere.
Bayern Munich’s transformation deserves particular attention. The SAP Arena move not only increased attendance by 75% but achieved 97% capacity utilisation – indicating they have found the right venue size for their market. This capacity efficiency suggests sustainable home advantage rather than a temporary boost.
Greek clubs Olympiacos and Panathinaikos maintain intense atmospheres despite attendance figures below the Serbian leaders. Greek basketball culture compensates for smaller raw numbers through supporter intensity that creates intimidation exceeding what numerical attendance might suggest.
Turkish venues combine large capacity with passionate fan bases. Istanbul’s arenas regularly exceed 10,000 attendance with organised supporter groups that specifically target opponent concentration. The combination of volume and intentional intimidation creates challenging road environments.
Attendance Trends and Betting Implications
Consistent near-capacity attendance indicates predictable home advantage that markets should – and typically do – price accurately. Volatile attendance suggests less reliable home court, potentially creating mispricing when markets assume stable crowd impact.
Weekday versus weekend attendance patterns vary by club and affect game-specific analysis. Some venues fill regardless of day; others show meaningful attendance drops for Tuesday fixtures compared to Friday games. Understanding these patterns helps assess whether standard home court adjustments apply to specific fixtures.
Opposition quality affects attendance at some venues. High-profile visitors draw larger crowds than mid-table opponents, creating variable home advantage that straight venue assessment cannot capture. Checking opponent-specific attendance history adds nuance to home court evaluation.
Weather and competing events occasionally depress attendance in ways that affect game dynamics. A major domestic football match scheduled simultaneously may thin the crowd at a basketball arena. Monitoring local context around game nights helps identify fixtures where expected atmosphere may not materialise.
Quantifying Crowd Energy Impact
Capacity percentage often matters more than raw attendance numbers. An arena at 95% capacity with 8,000 fans creates more intensity than one at 60% capacity with 12,000. The packed-arena energy of high utilisation generates atmosphere that empty seats cannot match regardless of absolute numbers.
Decibel measurements and independent atmosphere assessments occasionally surface for specific venues, providing qualitative confirmation of quantitative attendance data. When available, these assessments help distinguish genuinely hostile venues from high-attendance but passive environments.
Player and coach testimonials about venue difficulty provide soft data worth incorporating. When visiting players consistently describe certain arenas as the league’s toughest, that reputation typically reflects genuine competitive impact. These qualitative assessments complement numerical attendance data.
Historical ATS (against the spread) performance by venue offers the most direct test of home advantage value. An arena where home teams consistently cover suggests market underpricing of that venue’s impact; one where home teams frequently fail to cover suggests market overpricing. Tracking this data across seasons reveals genuine venue effects.
Frequently Asked Questions
Which EuroLeague arena has the highest attendance?
Partizan Belgrade’s Stark Arena led EuroLeague in 2024-25 attendance with an average of 18,486 fans per game at 98% capacity. Crvena Zvezda’s arena followed closely at 18,239 average attendance. The Serbian clubs consistently draw the largest crowds in European basketball.
How does attendance affect home court advantage in betting?
High attendance at near-full capacity creates intimidation that degrades visiting team performance. However, markets typically price obvious advantages. The betting opportunity lies in identifying venues where attendance impact is systematically under or overpriced – requiring comparison of attendance data against historical spread performance.
Using Attendance Data Effectively
Attendance statistics should inform rather than determine your betting approach. High attendance indicates potential home advantage; it does not guarantee it. Converting attendance data into betting value requires additional analysis of how that attendance translates to on-court performance and whether markets correctly price the impact.
Build venue profiles that track attendance, capacity utilisation, and historical spread performance together. Over a season, these profiles reveal which high-attendance venues actually produce betting value and which are accurately priced despite impressive crowd numbers.
Monitor venue changes and their effects on attendance. When clubs move arenas, add capacity, or implement new supporter initiatives, historical attendance baselines become unreliable. The Bayern Munich example demonstrates how significantly venue changes can alter competitive dynamics.
Combine attendance context with spread betting strategies to identify specific situations where crowd data creates actionable edges. A historically high-attendance venue with an afternoon tip-off and competing local event may not deliver its usual atmosphere. Recognising these exceptions within generally predictable patterns produces betting opportunities that blanket venue analysis misses.
Prepared by the Euroleague Basketball Betting editorial staff.